How Do Scientific Research and Accident Investigations Go Astray?

Scientists Make Mistakes for the Same Reasons that Accident Investigators Make Mistakes
How do scientific reachers and accident investigators go astray? I’ve read several articles about scientists and their reactions when experiments or research produce results that they weren’t expecting.
- They blame faulty instruments or reagents.
- They say that someone must have made a mistake.
- They toss the results and start over.
Why? Because their initial assumptions and hypothesized outcomes must be right!
This happens often. According to some research 50 – 75% of the time. And often, after even multiple examples of unexpected results, researchers would frequently just throw the results out and not discover why they had produced an anomaly.
The idea that researchers (or accident investigators) are objective is nonsense. The fact is that researchers who develop a hypothesis edit their reality – searching for evidence that confirms their hypothesis and discarding evidence that is counter to the results they expect.
Thus they can’t see why an unexpected outcome could prove something new. Instead, they believe it must be bad data or a failed experiment.
Accident Investigators Fall Into the Same Traps

Accident investigators who use cause-and-effect or the scientific method often fall into the same trap. They start their investigation by jumping to conclusions and, therefore, looking for evidence that confirms their conclusions. Their brain automatically discards information (they may not even see it) that provides alternatives to what they believe to be the “cause” of an accident.
Many people who claim they are only driven by the facts are actually driven by just the facts that fit their hypothesis. Other evidence is wrong. Someone is lying. The gauges must have been inaccurate. They couldn’t have witnessed what they claimed to have seen.

Here is a quote from an article in Wired Magazine (article written by contributing editor Jonah Lehrer:
As he tried to further understand how people deal with dissonant data, Dunbar conducted some experiments of his own. In one 2003 study, he had undergraduates at Dartmouth College watch a couple of short videos of two different-size balls falling. The first clip showed the two balls falling at the same rate. The second clip showed the larger ball falling at a faster rate. The footage was a reconstruction of the famous (and probably apocryphal) experiment performed by Galileo, in which he dropped cannonballs of different sizes from the Tower of Pisa. Galileo’s metal balls all landed at the exact same time — a refutation of Aristotle, who claimed that heavier objects fell faster.
While the students were watching the footage, Dunbar asked them to select the more accurate representation of gravity. Not surprisingly, undergraduates without a physics background disagreed with Galileo. (Intuitively, we’re all Aristotelians.) They found the two balls falling at the same rate to be deeply unrealistic, despite the fact that it’s how objects actually behave. Furthermore, when Dunbar monitored the subjects in an fMRI machine, he found that showing non-physics majors the correct video triggered a particular pattern of brain activation: There was a squirt of blood to the anterior cingulate cortex, a collar of tissue located in the center of the brain. The ACC is typically associated with the perception of errors and contradictions — neuroscientists often refer to it as part of the “Oh shit!” circuit — so it makes sense that it would be turned on when we watch a video of something that seems wrong.
So far, it is obvious that most undergrads are scientifically illiterate. However, Dunbar also conducted experiments with physics majors. As expected, their education enabled them to see the error, and for them, it was the inaccurate video that triggered the ACC.
But there’s another region of the brain that can be activated as we go about editing reality. It’s called the dorsolateral prefrontal cortex, or DLPFC. It’s located just behind the forehead and is one of the last brain areas to develop in young adults. It plays a crucial role in suppressing so-called unwanted representations, getting rid of those thoughts that don’t square with our preconceptions. For scientists, it’s a problem.
When physics students saw the Aristotelian video with the aberrant balls, their DLPFCs kicked into gear and they quickly deleted the image from their consciousness. In most contexts, this act of editing is an essential cognitive skill. (When the DLPFC is damaged, people often struggle to pay attention, since they can’t filter out irrelevant stimuli.) However, when it comes to noticing anomalies, an efficient prefrontal cortex can actually be a serious liability. The DLPFC is constantly censoring the world, erasing facts from our experience. If the ACC is the “Oh shit!” circuit, the DLPFC is the Delete key. When the ACC and DLPFC “turn on together, people aren’t just noticing that something doesn’t look right,” Dunbar says. “They’re also inhibiting that information.”
The lesson is that not all data is created equal in our mind’s eye: When it comes to interpreting our experiments, we see what we want to see and disregard the rest. The physics students, for instance, didn’t watch the video and wondered whether Galileo might be wrong. Instead, they put their trust in theory, tuning out whatever it couldn’t explain. Belief, in other words, is a kind of blindness.
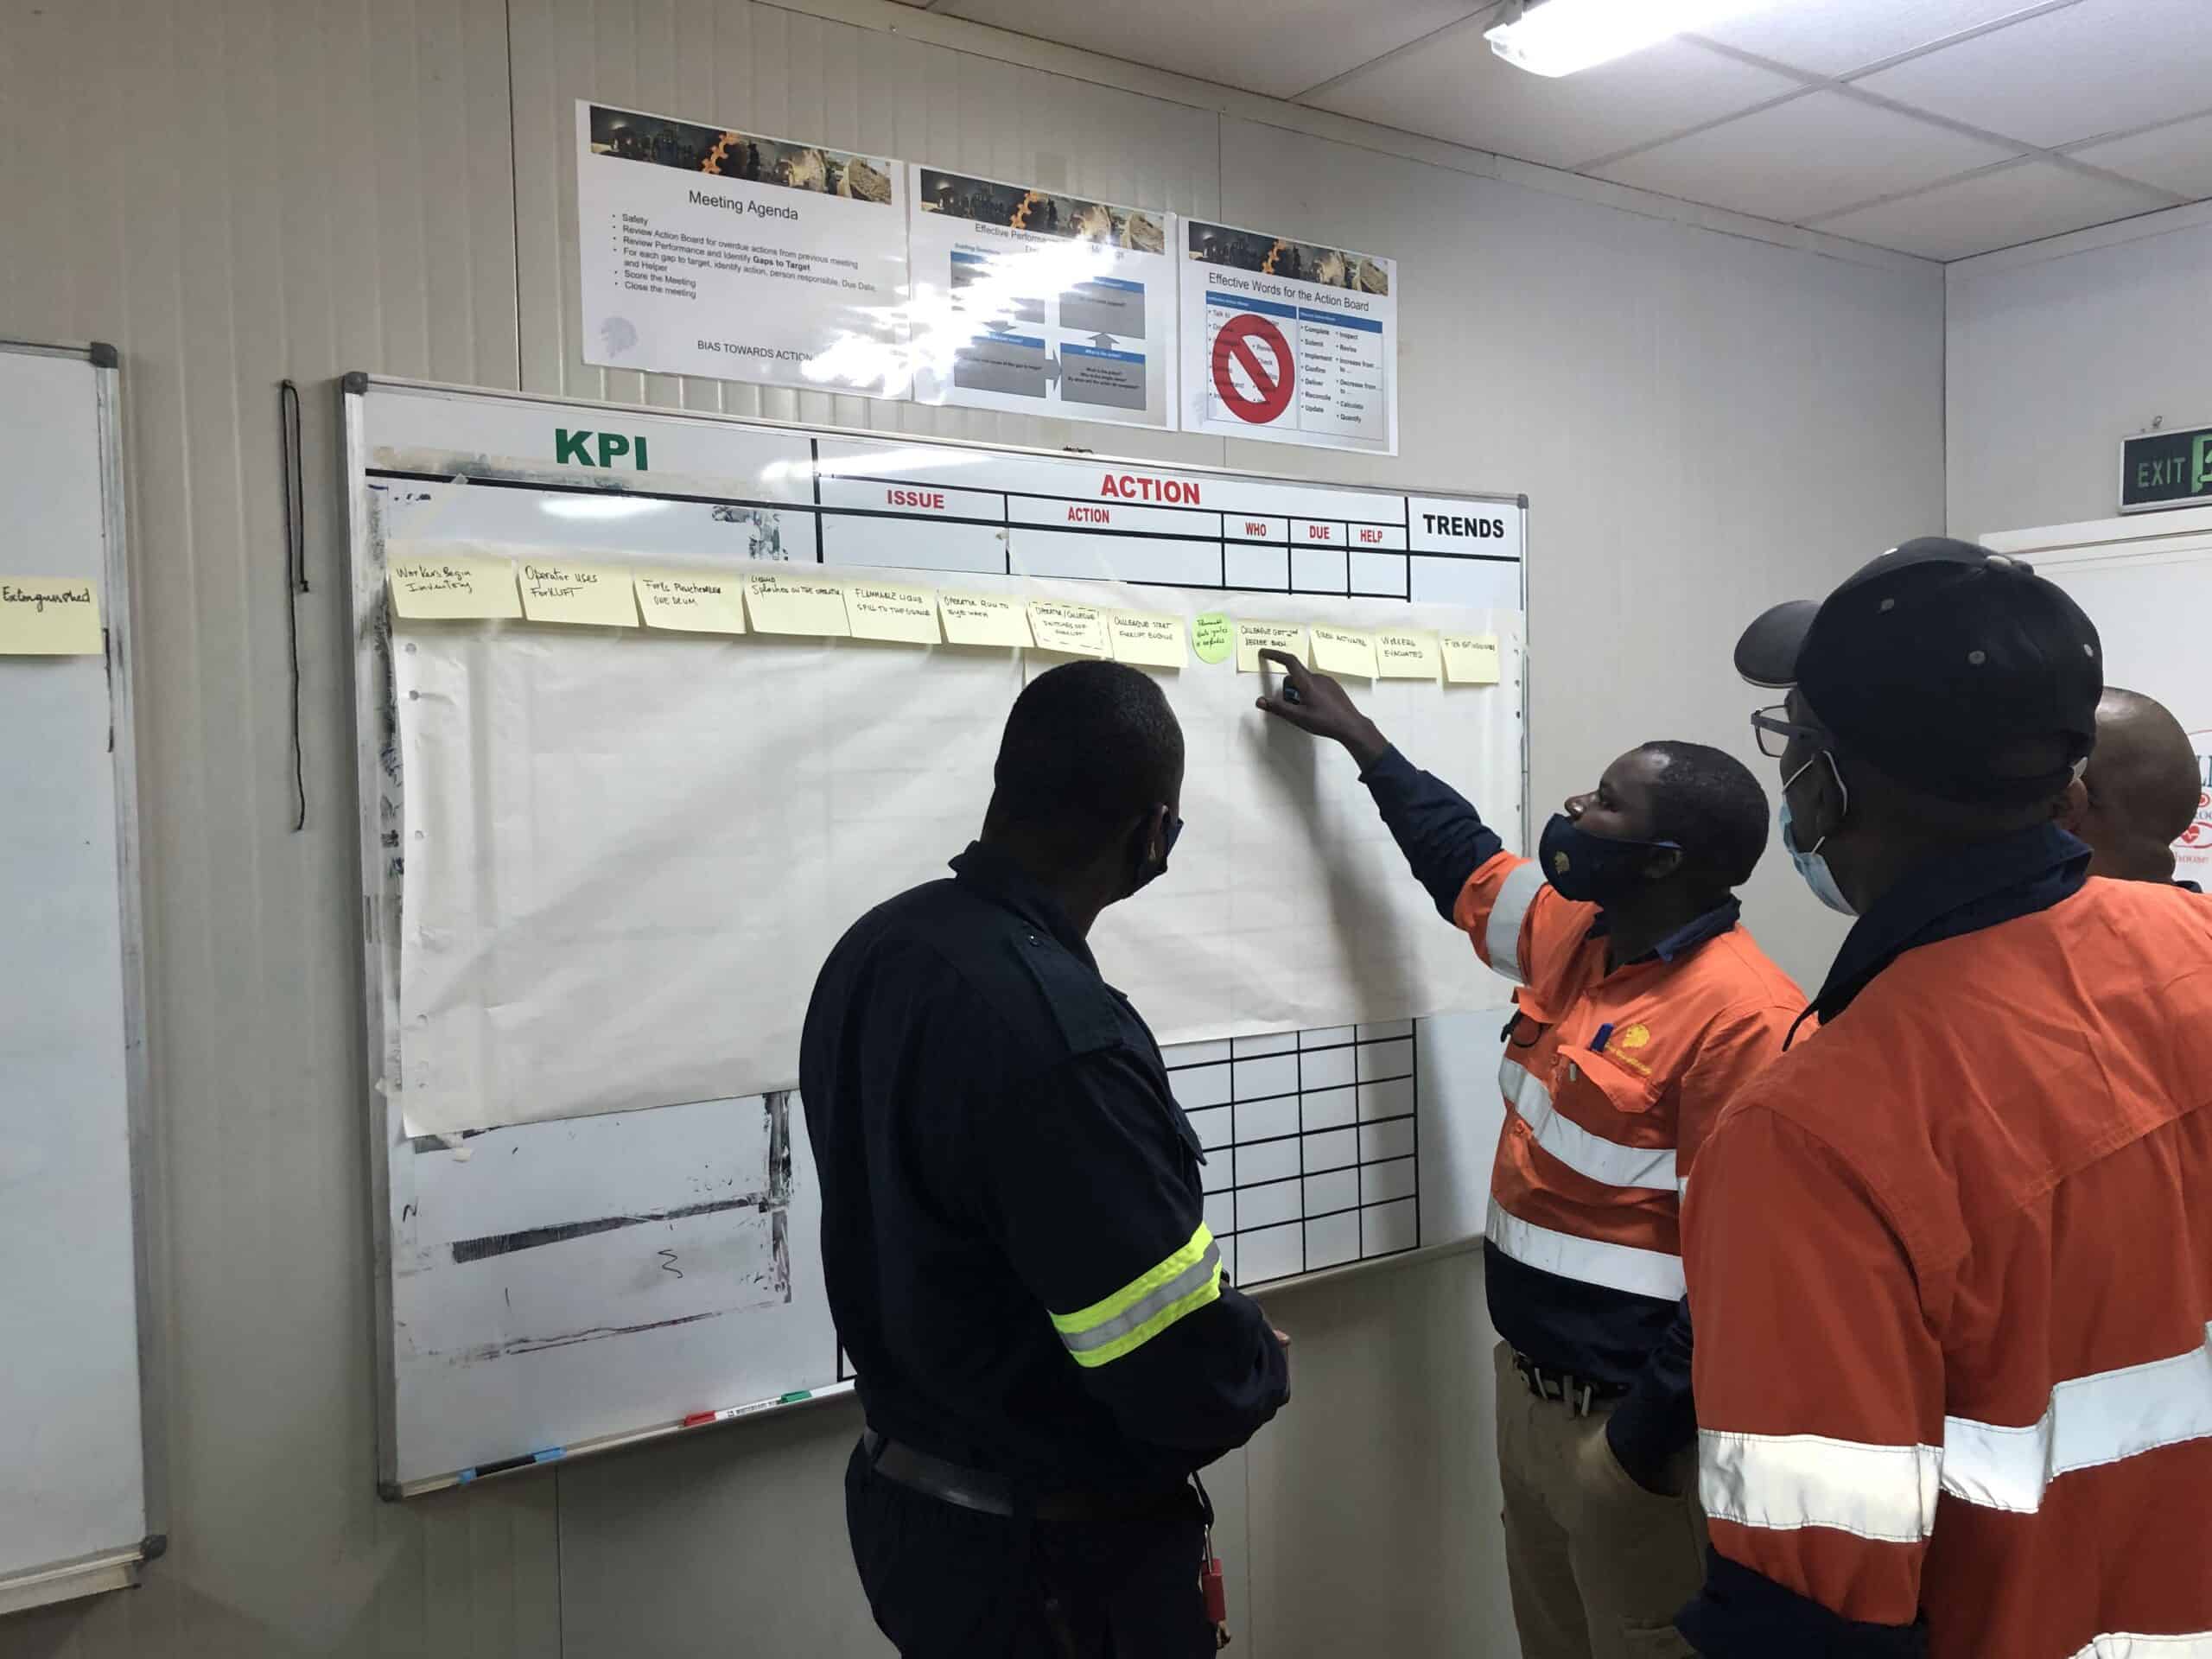
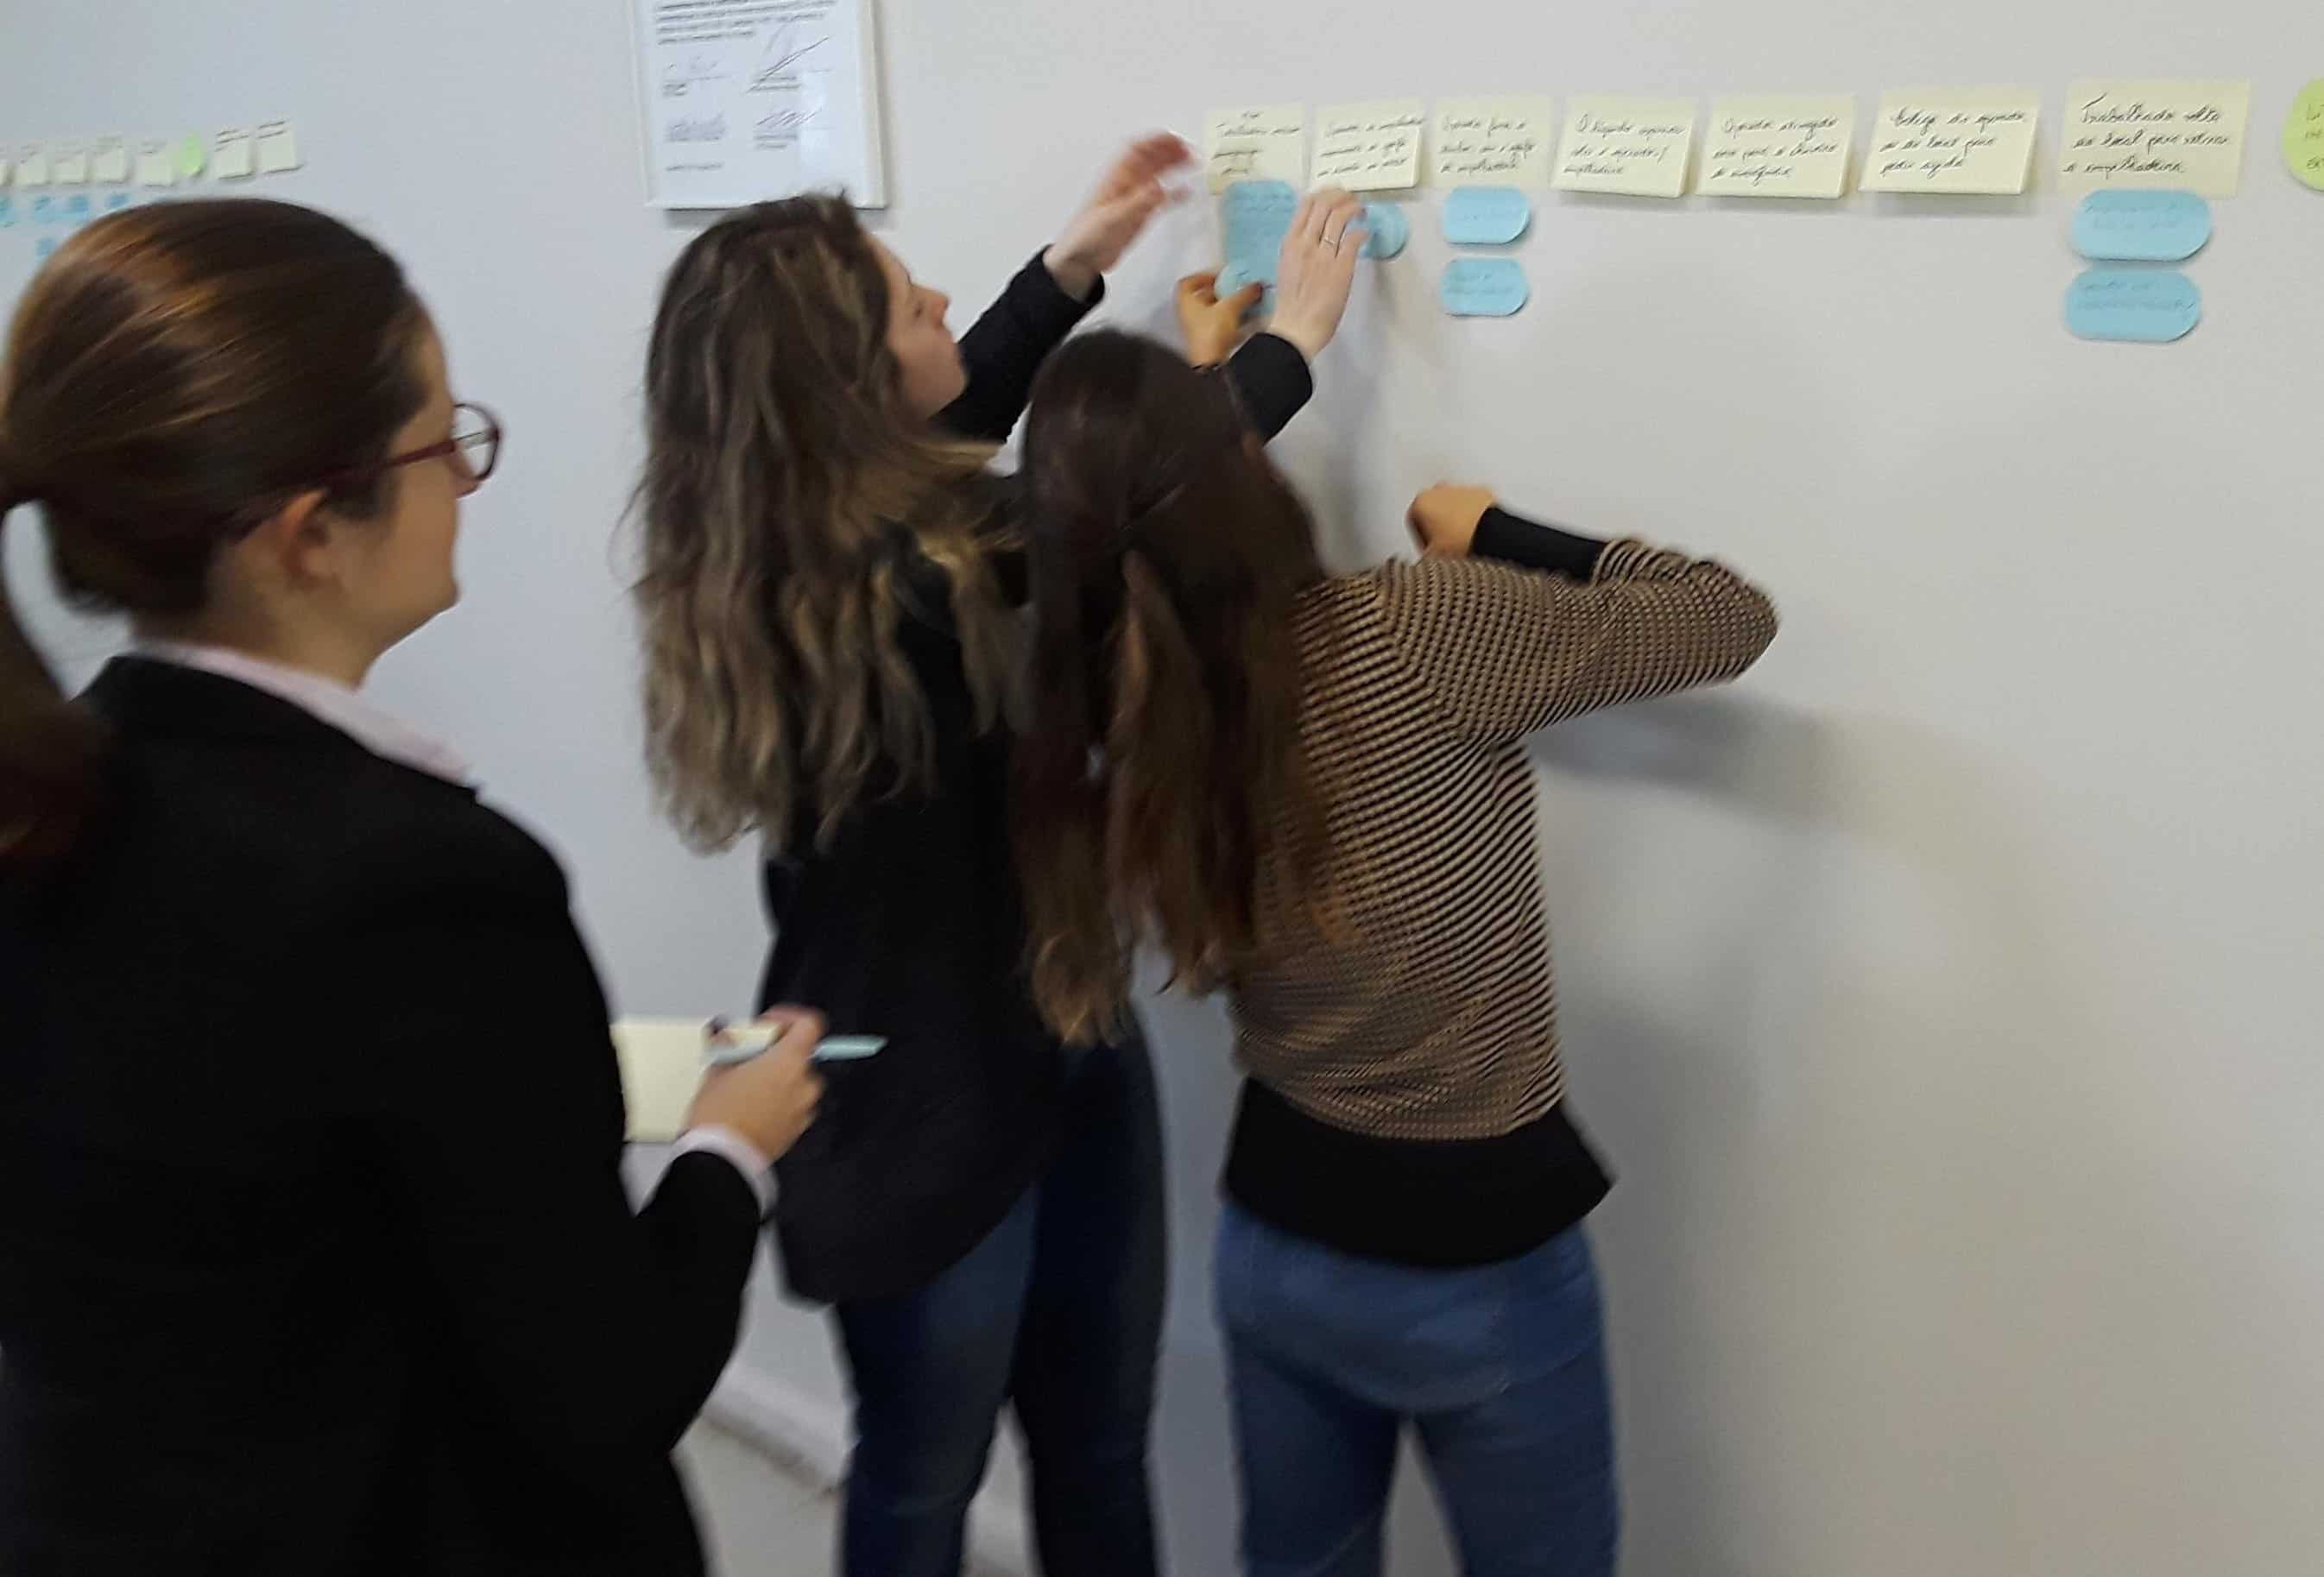
So, accident investigators need to be careful NOT to develop a hypothesis. They need to record the facts on a diagram that just displays what they found, not what they wanted to find. In TapRooT® Root Cause Analysis, that is a SnapCharT® Diagram.
Lesson Learned for Accident Investigators … Don’t Go Astray!
The way you perform your root cause analysis may prevent you from critically observing the evidence that you are collecting. If you start trying to prove a hypothesis you probably will be missing critical evidence that could lead you in a different direction.
Instead, you need to use the TapRooT® System to find root causes. Using TapRooT® Root Cause Analysis, you start by displaying the evidence you collect non-judgmentally on your SnapCharT® Diagram.
Once you understand what happened and how it happened, you are ready to define Causal Factors and analyze them to discover the root causes of each Causal Factor.
Learn More About Advanced Root Cause Analysis
Are you ready to learn more about advanced root cause analysis? Perhaps you are ready to attend one of our TapRooT® Root Cause Analysis Courses? See the different types of courses at THIS LINK.
Don’t wait and let your mind lead you astray. Attend TapRooT® Training as soon as you can.


