How Do You Use Root Cause Data? (2022 vs. 2014 Polls)

In 2014, I was at a meeting, and the topic came up of how people use their root cause data. To my surprise, about half the companies represented didn’t have a way to produce any type of graphs. The other half could produce pie charts using Microsoft Excel. There were one or two other people who had other ways to look at their data that they manually put into a system of some sort and displayed as a graph.
That got me thinking:
How do readers of this blog use their root cause analysis data?
So in 2014, I established the poll below so that people could respond.
How do you use your root cause analysis data:
1) We don’t have a way to collect our data across the site/company, so we don’t use it.
2) We collect the data but don’t have a way to present it graphically.
3) We collect the data and put it in Excel and produce pie charts.
4) We collect the data and put it in Excel and produce Pareto Charts and XmR Charts.
5) We collect the data and put it in Excel and produce other types of charts (please list them).
6) We use TapRooT® Software, but I haven’t thought about how to use our data.
7) We use TapRoot® Software and use the charting function in it to analyze our data.
8) We use other software and use it to trend our data using charts (please list software and chart types)
9) Other (tell us what you do)
Results of the 2014 Poll
We only had a few people respond to the poll.
The biggest result was that people were not trending root cause data.
The second category was people using Excel to make pie and bar charts.
That was it.
Recent 2022 Poll
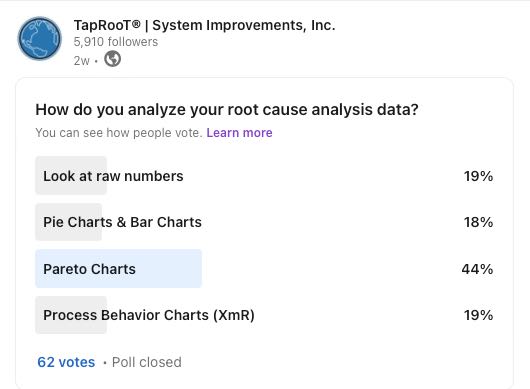
This year, I decided to publish another poll on LinkedIn with fewer choices (LinkedIn only allows four choices).
Here are the choices and results (62 votes)…

Now 63% use some sort of advanced trending tools (Pareto Charts or XmR Charts).
Why are the 2022 results different than the 2014 results?
It could be the improvements to the trending tools in the Version VI TapRooT® Software (that came out after the 2014 survey) helped people be better at analyzing their data.
It could be that TapRooT® Users have started using the advanced trending techniques that are described in Book 8: Performance Measures and Trending for Safety, Quality, and Business Management which was published in 2019. (After all, the poll was first published on the TapRooT® LinkedIn Page and then shared on six other pages, including the TapRooT® Users and Friends Group Page.)

If you would like to learn more about what’s in Book 8, read the article linked below…
37% of People Use Inadequate Techniques
Still, 37% of respondees were still looking at raw numbers or using inadequate pie and bar charts.
Why do I say these are inadequate techniques? There are many reasons, but we discuss some of the reasons in this article…
Many more of the reasons are covered in Book 8.
What Can You Do to Improve Your Trending?
The first thing is easy. Read Book 8.
The second idea is to attend the pre-Summit Course – Measurement, Trending, and Predictive Analytics: How the Best Use Data to Improve Work taught by Kevin McManus. Book 8 is included in this course.

Kevin is the Chief Excellence Officer of Great Systems LLC. Kevin provides virtual coaching and content to help people use proven best practices to enhance and optimize their daily work systems. Over forty years of work experience in roles such as Industrial Engineer, Training Manager, Production Manager, Plant Manager, and Director of Quality give Kevin a ‘real life work’ perspective relative to daily work process optimization, work team engagement and empowerment, and sustainable operational excellence. He served as a national Malcolm Baldrige Performance Excellence Award Examiner for twenty years, including a three-year term on the national Judge’s Panel. Kevin is also an Institute of Industrial and Systems Engineering Fellow. He is an experienced TapRooT® Instructor and holds an undergraduate degree in Industrial Engineering and an MBA.
In this 2-day workshop, you learn how to:
• Identify leading counts and ratios that best reflect the ‘vital signs’ of process performance
• Set up a simple process to capture and crunch daily process information
• Review and use measurement results daily to predict, anticipate, and improve performance
• Recognize and engage team members in effective daily measure use
• Select options to improve the design of your existing measurement work system
CLICK HERE to register for this 2-day course being held on April 24-25 at the Margaritaville Lake Resort, Lake Conroe, near Houston.
This course is being held prior to the annual Global TapRooT® Summit. If you register for the course and the Summit at the same time, you will SAVE $300 off the course fee. CLICK HERE for more Summit information and CLICK HERE to register for both the course and the Summit and SAVE.


