Parallel Paths on a SnapCharT® Diagram
Simple SnapCharT® vs Advanced SnapCharT®
One of the things we teach in our TapRooT® ® Root Cause Analysis Training is the importance of developing a SnapCharT® to understand what happened to cause an incident. We also teach that there is no such thing as a perfect SnapCharT® and that as long as yours helps you understand what really happened, it is good enough. None the less, there are things you can do to make your SnapCharT® better – easier to understand and more accurate. That’s what we are going to explain today:
When to use parallel paths.
Simple SnapCharT® Diagram

Above is a simple SnapCharT® Diagram at the start of a fairly simple incident investigation – somebody sprained their ankle. This is at the start of a low-to-medium risk incident investigation (the first step in the process below).

If you continued the investigation, you might find this incident is NOT so simple.
Parallel Paths
In the simple SnapCharT® Diagram above, there is a single sequence of events that are laid out chronologically. But in the theory of causation, one thing does not necessarily lead to another. The boxes (events) are simply in order of the time they occurred.
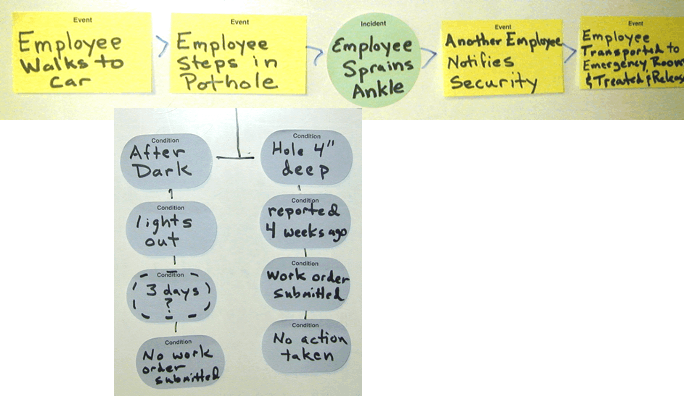
But in the SnapCharT® below, there are three parallel paths that come together when the employee steps in a pothole.

The first sequence of events has to do with the creation of the pothole.
The second has to do with the lights failing (breaker trips).
And the third has to do with the employee walking to their car.
These three sequences converge at the pothole.
Why is this important? Because the SnapCharT® has two initiating Causal Factors and two other Causal Factors. This becomes apparent when you complete your Causal Factor Worksheet.
Also, the sequence makes more sense when laid out in separate paths.
For example, if we had the Event – “the Truck weight exceeds asphalt rating – causes pothole” – leading to the next Event – “Breaker trips and parking lot lights are disabled” – there isn’t a causal relationship from one event to the next. Heavy trucks didn’t cause the breaker to open.
Yes, you can understand what happened when reviewing a simple time sequence, but one Event does not cause (or lead to) the next.
Two Ways to Learn More About Using TapRooT® Root Cause Analysis and SnapCharT®s
If you have already attended the 2-Day TapRooT® Root Cause Analysis Training but you would like to learn more of the subtleties about the techniques and become more of a TapRooT® Expert, you have two main choices to expand your knowledge…
- Attend the 5-Day TapRooT® Advanced Root Cause Analysis Team leader Training. This will refresh your knowledge for simple incident investigation and cover the steps and techniques for the advanced 7-Step TapRooT® Root Cause Analysis Process for major investigations. The course also covers human performance improvement techniques and the details of using the TapRooT® Software.
- Join us for the 2021 Global TapRooT® Summit. You can attend the LIVE Summit in Knoxville, TN, on June 14-18 OR the VIRTUAL Summit. Either one will let you participate in the lessons TapRooT® Users share to expand your knowledge of how to apply TapRooT® RCA to improve performance.

Hope this short description of how to use parallel paths in a SnapCharT® helps you create even easier to understand SnapCharT® Diagrams.
Please feel free to CONTACT US if you have any questions about developing a SnapCharT® or using TapRooT®.