Are These Safety Statistic Trends Significant?
ASSP Headline: Work-Related Fatalities Up Nearly Six Percent
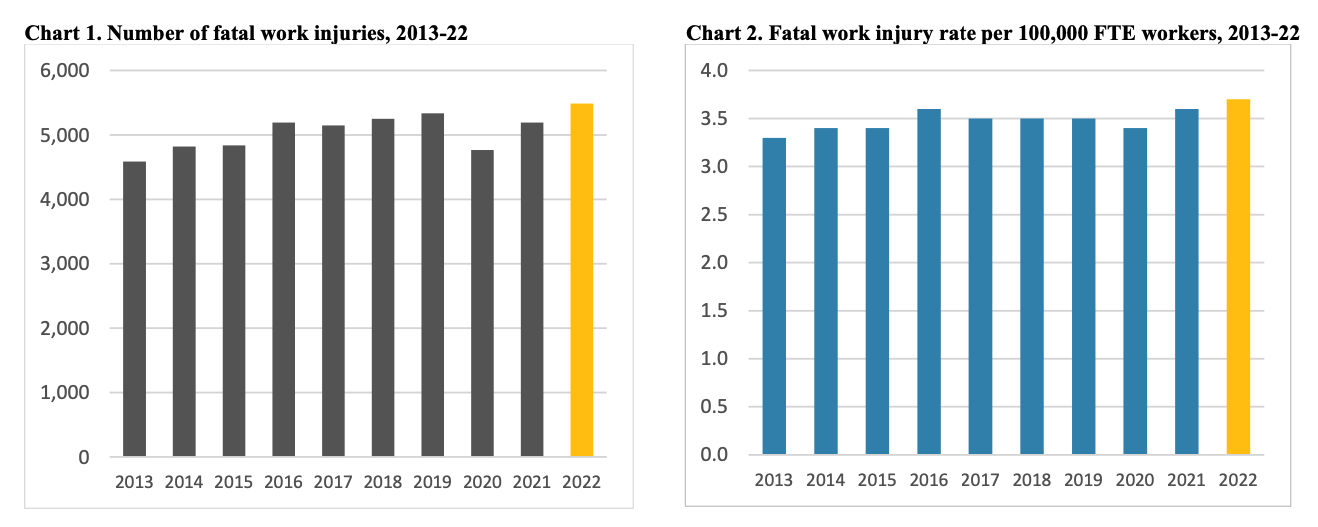
ASSP News reported on the U.S. Bureau of Labor Statistics’ annual census of fatal work injuries for 2022. The headline above (Work-Related Fatalities Up Nearly Six Percent) was how ASSP News started the story. US BLS used these graphs above to make their point.
By the headline from ASSP News and the press release from the BLS, one would think that these are significant safety statistic trends.
My first thought was:
“Are these changes significant?“
My second thought was:
“What was the impact of COVID on these statistics,
and did the type of work change pre and post-COVID?“
How to Measure Significance
Can you calculate if a trend is significant?
We teach how to judge significance using a Process Behavior Chart. You can learn more about using Process Behaviour Charts to trend your company’s safety statics in two places:
- Book 8: TapRooT® Performance Measures and Trending for Safety, Quality, and Business Management.
- 2-Day Measurement, Trending, and Predictive Analytics: How the Best Use Data Every Day to Improve Work Course
The next Tending Course is being taught on April 29-30, just before the 2024 Global TapRooT® Summit. The course was developed and is being taught by Kevin McManus, Chief Excellence Officer and Owner of Great Systems!

Process Behaviour Chart
What does a Process Behaviour Chart look like? Below is an example.

Points inside the dotted lines are normal system variations. Points outside the dotted lines are abnormal or special variations. These points outside the dotted lines are a significant trend.
You can calculate the values for the dotted lines using fairly simple math and plot these charts manually on graph paper or using Excel or specialized software.
I didn’t plot the data in Chart 2 above, but I doubt that a 0.1 change in the injury rate is significant.
Do You Make Knee-Jerk Reactions to “Trends?”

A common mistake that management makes is reacting to false trends. Trends that aren’t significant. Management wastes valuable resources and causes employee morale issues when they make these knee-jerk reactions. W. Edwards Deming wrote about this type of crisis management. I also wrote an article in 2023 – Trending Performance “Bad Practices” Recommended as “Best Practices.”

I will talk about these kinds of mistakes at the 2024 Global TapRooT® Summit in the Best Practice Breakout Session Titled:
Using Trending to Manage Improvement
This is just one of the nine Best Practice Breakout Sessions in the Better Improvement Programs & CAPA Track at the Summit. Plus there are six other Tracks at the Summit and you can pick from any of the tracks to customize your Summit experience.
2024 Global TapRooT® Summit Information
Find out more about the Summit in the video below…
Or CLICK HERE for the Summit Brochure and HERE TO REGISTER for the Summit and one of the pre-Summit Courses (for example, Kevin’s trending course).
But whatever you do, don’t have a knee-jerk reaction to a trend that isn’t significant.