What Does a Bad Day Look Like? (Hernando de Soto Bridge Crack and Near-Collapse)
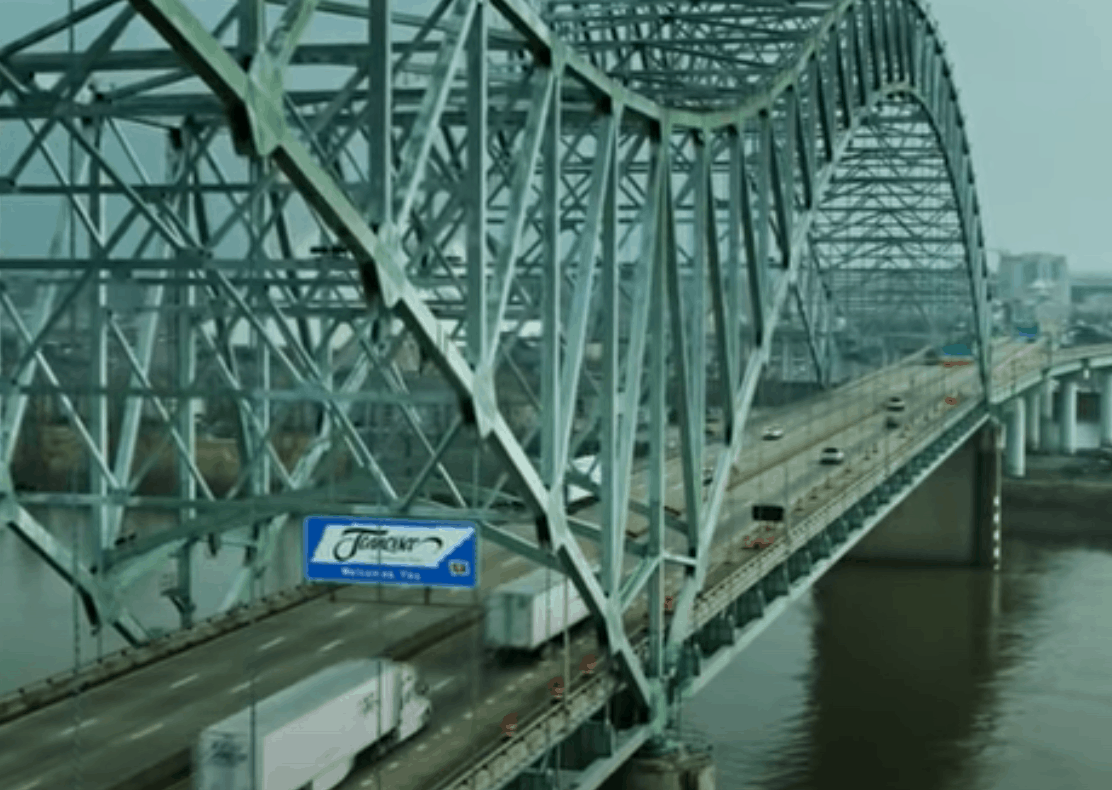
Hernando de Soto Bridge Crack
The root cause analysis of Hernando de Soto Bridge crack and near-disaster certainly will be interesting. Has it been completed? Not by the time that the first action was taken (besides closing the bridge). They fired an inspector.
Now watch this video…
From this video, you can see there are several causal factors that include human errors that need to be analyzed by advanced root cause analysis. Some of the causal factors go back to design choices prior to the 1968 construction of the bridge.
Here is a CNN article about the causes of the crack…
And here is another article (CLICK HERE) that tells of a 2019 proposal by a University of Memphis professor to analyze stresses on the bridge because the M bridges design could lead to cracks. The study was not performed.
Thus, the SnapCharT® Diagram to complete a root cause analysis would include the initial design decisions made back in the 1960s, inspections performed since then, research and studies performed since the initial construction, and decisions not to follow up on reported problems (at least one of which was reported in 2019).
If you would like to learn more about advanced root cause analysis, consider attending a TapRooT® Root Cause Analysis Course.